INTRALOT | The Correlation Between Data and Performance Across Multiple Jurisdictions, at NASPL Insights, May/June 2020
Read the full Magazine online
The Correlation Between Data and Performance Across Multiple Jurisdictions
Applying big data analytics to key performance indicators helps refine comparisons across jurisdictions in order to maximize opportunities for growth.
By Mark Mitchell, Senior Manager BI & Analytics, INTRALOT USA
Technology has been playing a significant role in the transformation of the lottery industry over the last decade. It has helped to better understand lottery operations and performance, identify revenue opportunities and craft best practices.
Every lottery collects large amounts of data and the ability to navigate through them and to determine insight is very important to the growth of our industry. A primary goal is to be able to identify a good portion of the data that will provide our teams the proper knowledge to make informed, data-driven business decisions. Some of the biggest challenges specific to the lottery industry include comparing sales while also accounting for multiple variables such as elevated jackpots, marketing, new product launches, promotions, seasonality, player profiles and unforeseen economic impact. Additionally, being able to apply a successful case of a product offering in one jurisdiction to another jurisdiction can be difficult without understanding the necessary supporting data.
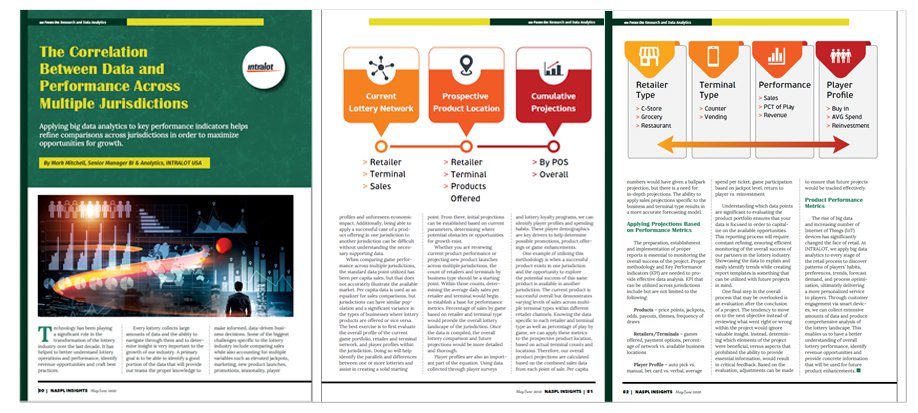
When comparing game performance across multiple jurisdictions, the standard data point utilized has been per capita sales, but that does not accurately illustrate the available market. Per capita data is used as an equalizer for sales comparisons, but jurisdictions can have similar population and a significant variance in the types of businesses where lottery products are offered or vice versa. The best exercise is to first evaluate the overall profile of the current game portfolio, retailer and terminal network, and player profiles within the jurisdiction. Doing so will help identify the parallels and differences between one or more lotteries and assist in creating a solid starting point. From there, initial projections can be established based on current parameters, determining where potential obstacles or opportunities for growth exist.
Whether you are reviewing current product performance or projecting new product launches across multiple jurisdictions, the count of retailers and terminals by business type should be a starting point. Within those counts, determining the average daily sales per retailer and terminal would begin to establish a base for performance metrics. Percentage of sales by game based on retailer and terminal type would provide the overall lottery landscape of the jurisdiction. Once the data is compiled, the overall lottery comparison and future projections would be more detailed and thorough.
Player profiles are also an important part of the equation. Using data collected through layer surveys and lottery loyalty programs, we can identify player profiles and spending habits. These player demographics are key drivers to help determine possible promotions, product offerings or game enhancements.
One example of utilizing this methodology is when a successful product exists in one jurisdiction and the opportunity to explore the potential success of this same product is available in another jurisdiction. The current product is successful overall but demonstrates varying levels of sales across multiple terminal types within different retailer channels. Knowing the data specific to each retailer and terminal type as well as percentage of play by game, we can apply these metrics to the prospective product location, based on actual terminal counts and locations. Therefore, our overall product projections are calculated based on the combined sales data from each point of sale. Per capita numbers would have given a ballpark projection, but there is a need for in-depth projections. The ability to apply sales projections specific to the business and terminal type results in a more accurate forecasting model.
Applying Projections Based on Performance Metrics
The preparation, establishment and implementation of proper reports is essential to monitoring the overall success of the project. Proper methodology and Key Performance Indicators (KPI) are needed to provide effective data analysis. KPI that can be utilized across jurisdictions include but are not limited to the following:
- Products – price points, jackpots, odds, payouts, themes, frequency of draws
- Retailers/Terminals – games offered, payment options, percentage of network vs. available business locations
- Player Profile – auto pick vs. manual, bet card vs. verbal, average spend per ticket, game participation based on jackpot level, return to player vs. reinvestment
One final step in the overall process that may be overlooked is an evaluation after the conclusion of a project. The tendency to move on to the next objective instead of reviewing what went right or wrong within the project would ignore valuable insight. Instead, etermining which elements of the project were beneficial, versus aspects that prohibited the ability to provide essential information, would result in critical feedback. Based on the evaluation, adjustments can be made to ensure that future projects would be tracked effectively.
Product Performance Metrics
The rise of big data and increasing number of Internet of Things (IoT) devices has significantly changed the face of retail. At INTRALOT, we apply big data analytics to every stage of the retail process to discover patterns of players’ habits, preferences, trends, forecast demand, and process optimization, ultimately delivering a more personalized service to players. Through customer engagement via smart devices, we can collect extensive amounts of data and produce comprehensive analysis of the lottery landscape. This enables us to have a better understanding of overall lottery performance, identify revenue opportunities and provide concrete information that will be used for future product enhancements.